Welcome to our classroom demographics overview. Students enrolled in business courses range from those seeking a business degree, to students earning their business minor, to students who've chosen to further their degree in another field with a business elective.
The richness of our student body is something we seek to support with class offerings that Lumberjacks can apply to their future careers, regardless of major.
Fall 2023 classroom overview
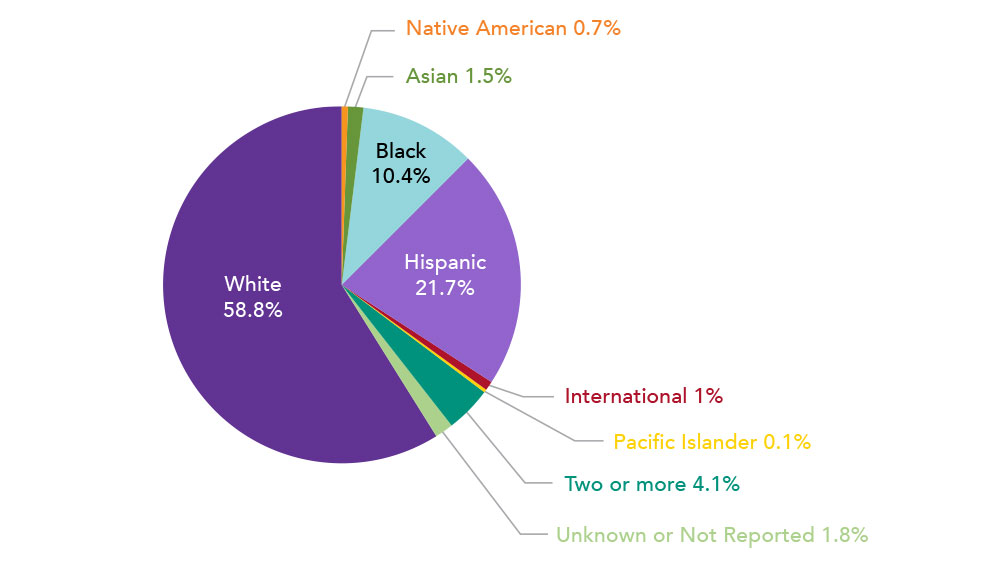
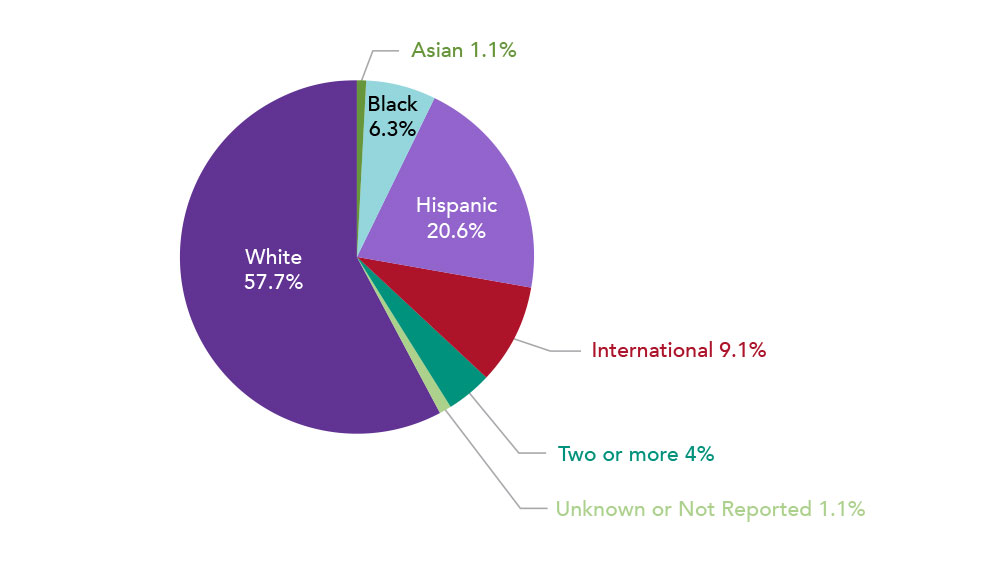
SFA’s Office of Strategic Analytics and Institutional Research collected the following data, which focuses on SFA students who were enrolled in a business class on the fall 2023 official reporting day. Percentages may not equal 100 due to rounding.
Texas Region
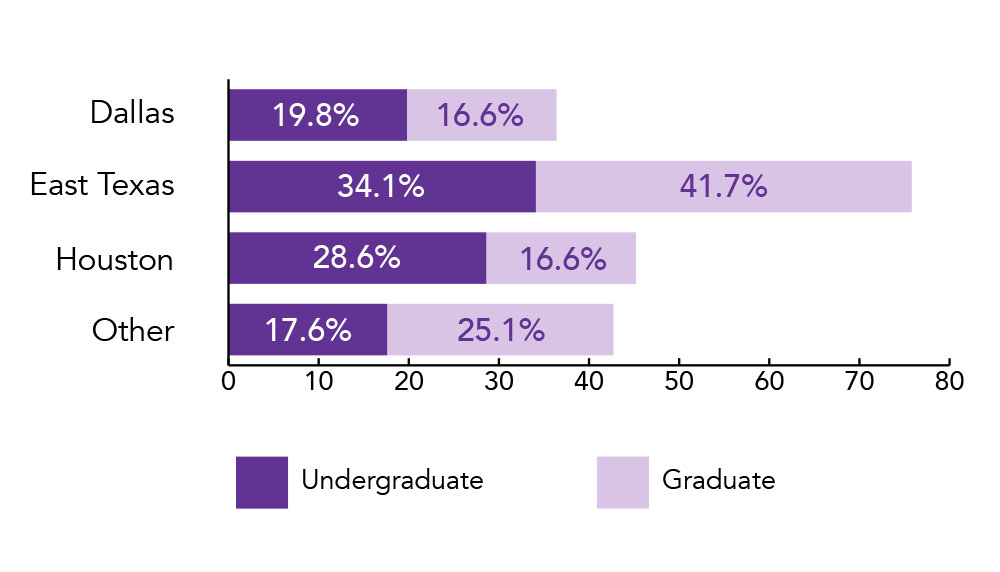
| Texas Region | Undergraduate | Graduate |
|---|---|---|
| Dallas | 19.8% | 16.6% |
| East Texas | 34.1% | 41.7% |
| Houston | 28.6% | 16.6% |
| Other | 17.6% | 25.1% |
Age Range
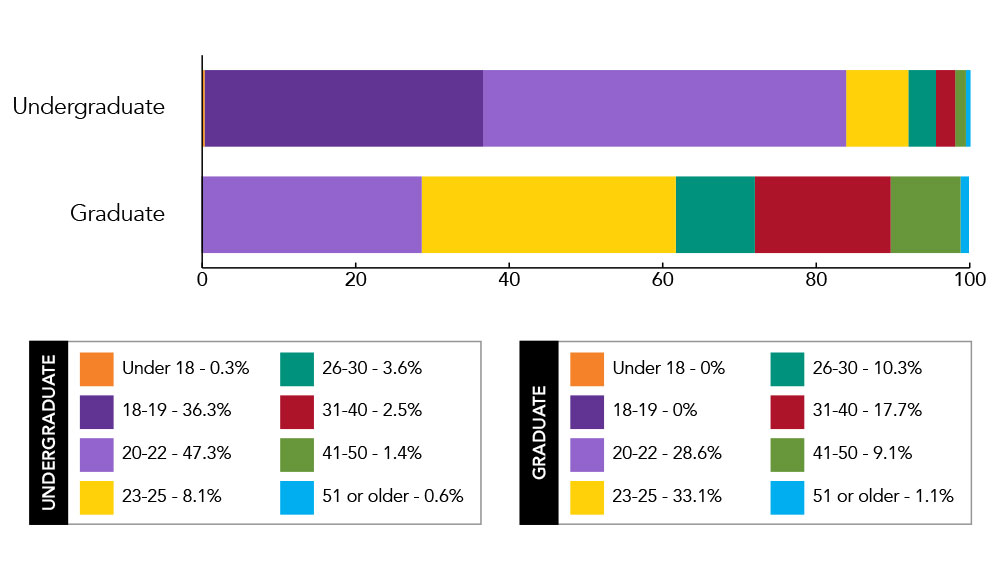
| Age Range | Undergraduate | Graduate |
|---|---|---|
| < 18 | 0.3% | 0.0% |
| 18-19 | 36.3% | 0.0% |
| 20-22 | 47.3% | 26.6% |
| 23-25 | 8.1% | 33.1% |
| 26-30 | 3.6% | 10.3% |
| 31-40 | 2.5% | 17.7% |
| 41-50 | 1.4% | 9.1% |
| 51 > | 0.6% | 1.1% |
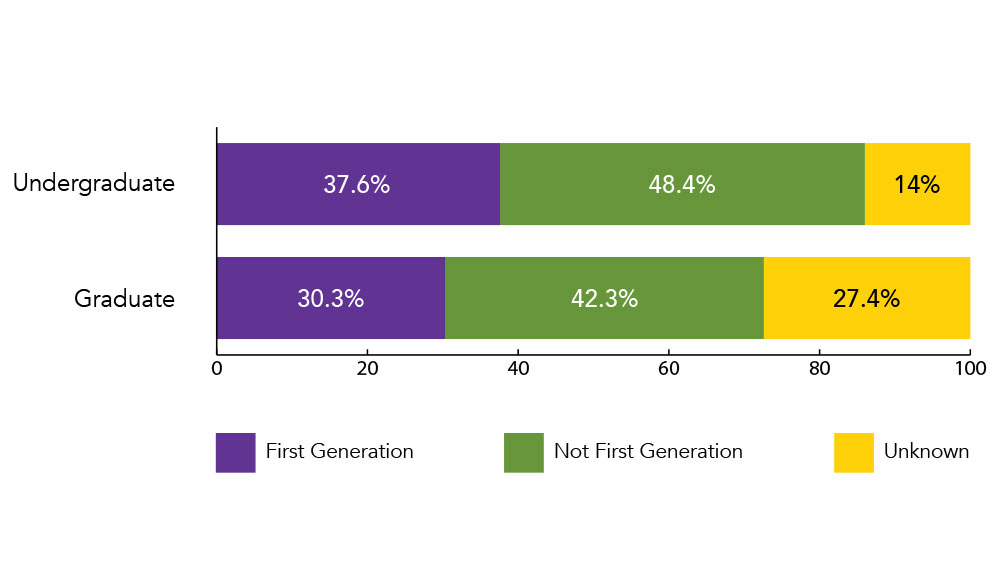
| First-Generation Status | Undergraduate | Graduate |
|---|---|---|
| First Generation | 37.6% | 30.3% |
| Not First Generation | 48.4% | 42.3% |
| Unknown | 14.0% | 27.4% |